Many people suppose that critics and the public have very different tastes in movies. However, analysis of online ratings shows that film fans – those keen enough to vote on websites – tend to have similar tastes to critics. Nevertheless, tastes of critics and film fans do appear to be quite different from those of a wider audience represented by market research and box office income.
To measure movie viewers’ tastes, we have looked at online ratings for movies, and results from market research.
Comparing the ratings from critics and film fans
We have first looked at the tastes of critics and “film fans”, defined as those who are engaged enough to fill in ratings on specialist film websites. We have assembled and analysed six series of ratings. Two are from critics, four are from film fans. The six data series used are IMDb, Letterboxd, Rotten Tomatoes critics and public, and Metacritic critics and public.
The dataset contains just over 9000 films (n = 9063), and consists of feature length dramas. Each of these films has ratings from all six data series, giving a total of approximately 54,000 data points.
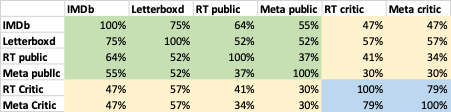
Table 1 shows the correlations (r-squared values) between ratings from each source, based on standard linear regression. The scores are highly positively correlated, so a film which gets high ratings from one source (for example IMDb) tends to get high ratings from other sources (for example Rotten Tomatoes critics). The results are highly statistically significant given the large number of data points
The proportion of the variance in one series of critics’ scores accounted for by the other series is 79%. The variance in a series of film fan scores accounted for by another series averages 56%. The corresponding figures for public and the critics are lower, averaging 43%, but still strong[i].
There is thus a consistent tendency towards broad agreement among film fans and critics about whether a particular film is good or not.
Table 1: Correlations (r-squared values) between ratings for each movie from different sources
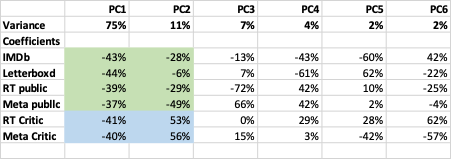
These findings are supported by examining what accounts for variations in ratings using Principal Component Analysis[ii]. Broadly speaking, each principal component is a weighted combination of the ratings series that best captures any variation not captured by a previous component. The first principal component (PC1) explains the largest proportion of the variance in ratings. The second principal component (PC2) the largest proportion of variance not captured by the first principal component, and so forth.
The results are shown in Table 2. They indicate that the First Principal Component (PC1) dominates the results, accounting for about 75% of variation. For PC1. all six sources have almost identical signs and magnitudes, of around –40%. This implies that they all have something in common which leads them to move together. We interpret as component as corresponding to film quality – how well-regarded a film is.
Nevertheless, there are consistent differences in the ratings from film fans and critics, indicating systematic differences in tastes. Looking at the Second Principal Component (PC2), the two critics’ series have similar weightings of around 55%, while the four fan-based series have different magnitudes and signs. We interpret this Second Principal Component as critics’ preferences, which are different from the views of film fans. This accounts for a further 11% of the variation in ratings. This is consistent with the somewhat lower correlation between critics’ and film fans’ ratings shown in Table 1.
The remaining principal components are less significant, and have no clear interpretation.
Table 2: Results of Principal Component Analysis
All of these tendencies are naturally subject to enormous variation for individual films, leading to outliers. For example, Where the Crawdads Sing (2022) has a rating of 96% from Rotten Tomatoes’ viewers, but 34% from critics. Similarly, ratings are averages, with widely different scores from different viewers. For example, most agree that The Lord of the Rings films (2001-2004), with an IMDb rating of 8.8-8.9, are excellent, and that Artemis Fowl (2020), with an IMDb rating of 4.3, is not. However, there is a small minority of ratings from people who don’t like The Lord of the Rings, and a few who award Artemis Fowl higher ratings, with around 10% of voters giving it a rating on IMDb of 8 or more.
What about the wider audience?
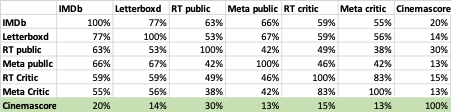
To identify whether these patterns extend to the wider audience we have looked at ratings from CinemaScore. These are based on market research, looking beyond film fans to a representative sample of viewers. The dataset is smaller, with around 3000 films, consisting mainly of mainstream American releases since the mid 1980s.
The correlations (r-squared values) are shown in Table 3[iii]. The correlations between CinemaScore and the other data series are lower, with r-squared values mostly in the range 13% to 20%. This implies that the opinions of a wider set of movie goers are less similar to those of film fans and critics, though there is some relationship.
Table 3: Correlations (r-squared values) including CinemaScore market research
The relationship between ratings from critics and film fans to financial indicators such as box-office receipts, which depend on general appeal to viewers, is complex. However, there appears to be at best a weak or non-existent relationship[iv]. This will be the subject of a separate analysis.
The expectation that the public and critics diverge widely in their evaluation of a particular film is thus supported by the analysis. However, it is not the whole story. There is some small degree of correspondence between the results of market research and how highly film fans rate a movie. And the tastes of film fans are quite close to those of critics, although significant differences remain.
[i] These values for r2 are broadly in line with work by others. However, the analysis presented here differs, for example, in the sample of films, the data series included, and questions addressed.
[ii] Principal Component Analysis is a well-established technique used to simplify complex datasets by transforming a large set of variables into a smaller one that still contains much of the original information. It achieves this by identifying new, uncorrelated axes (principal components) that capture the maximum amount of variance in the data.
[iii] The correlations between the other six data series are somewhat different from those in Table 1, as the sample of films is different.